
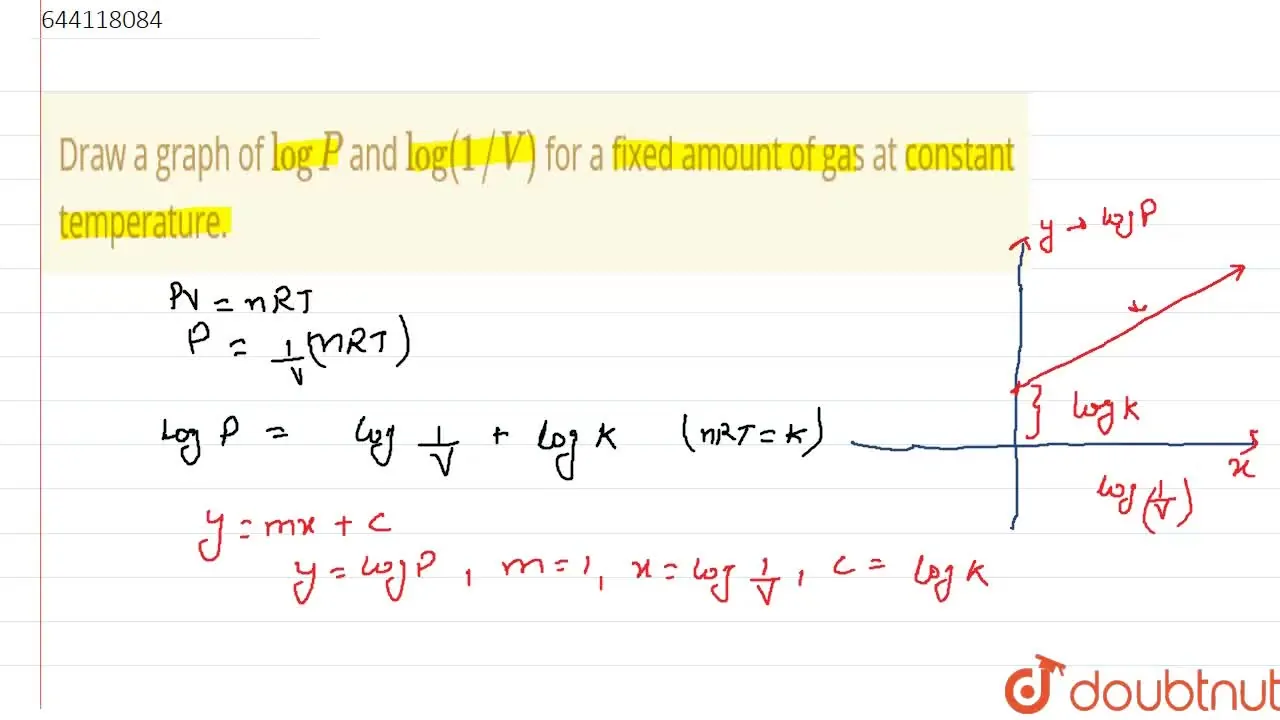
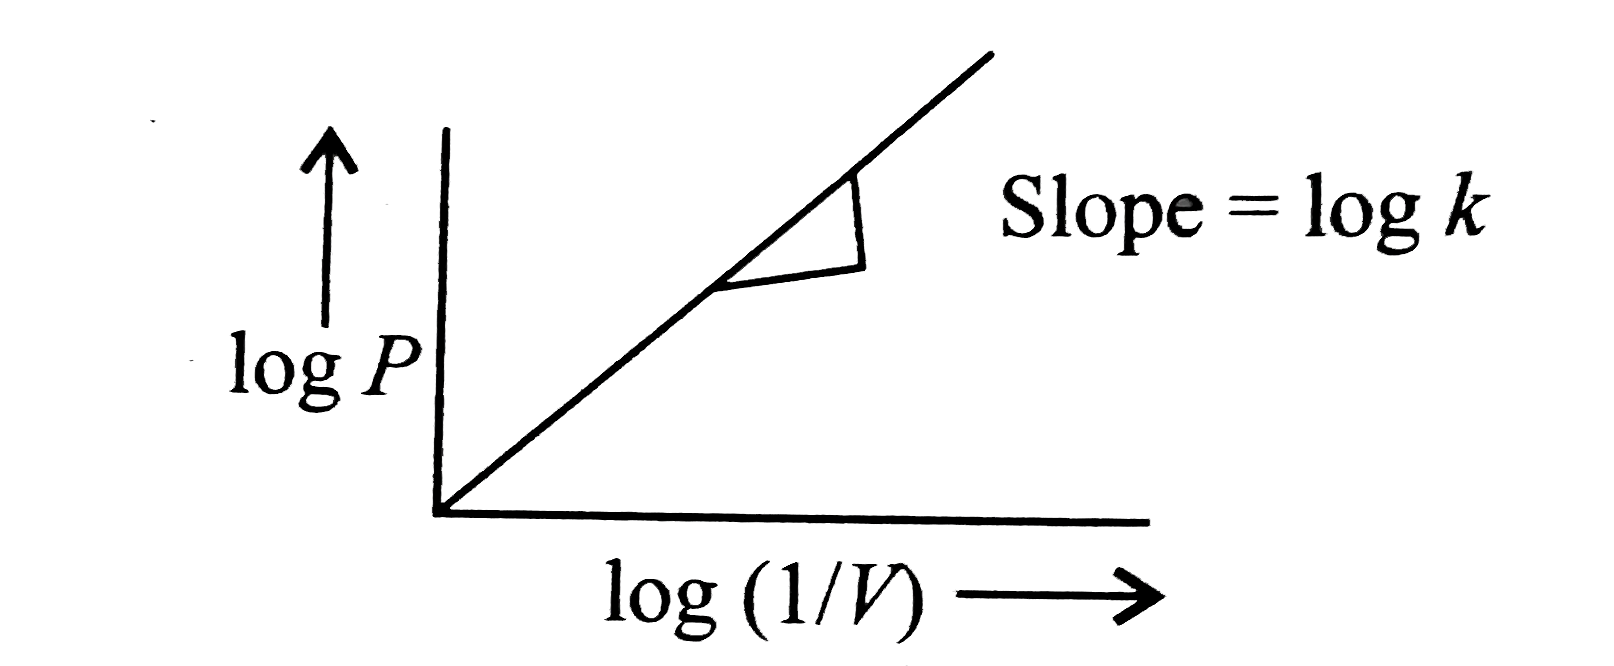
Draw a graph of logP and log(1/V) for a fixed amount of gas at constant temperature.
Video Solution

Text Solution
According to Boyle's law, P=log(1/V)+logK
Comparing it to y=mx+c, we find that the graph of logPvslog(1/V) should be a straight line with slope equal to k, i.e.
|
Updated on:21/07/2023
Class 11 CHEMISTRY STATES OF MATTER
Related Playlists
- BOOK - CENGAGE CHEMISTRY ENGLISHCHAPTER - STATES OF MATTEREXERCISE - Illustration2videos
STATES OF MATTER
- BOOK - CENGAGE CHEMISTRY ENGLISHCHAPTER - STATES OF MATTEREXERCISE - Exercises21videos
STATES OF MATTER
- BOOK - CENGAGE CHEMISTRY ENGLISHCHAPTER - SOME BASIC CONCEPTS AND MOLE CONCEPTEXERCISE - Archives Subjective11videos
SOME BASIC CONCEPTS AND MOLE CONCEPT
- BOOK - CENGAGE CHEMISTRY ENGLISHCHAPTER - STOICHIOMETRYEXERCISE - Archives Subjective33videos
STOICHIOMETRY
Similar Questions
-
Draw a graph of log P vs log (1/V) for a fixed amount of a gas at constant temperature.
View Solution -
Draw the graph of y=log2x.
View Solution -
Draw the graph of y=x/ln x
View Solution -
Draw the graph of y=−logex.
View Solution -
What is the type of graph between log P and log(1V) at constant temperature for a given amount of gas ?
View Solution -
Draw the plot log P vs log V for Boyle's law.
View Solution -
Draw the graph of y=logx√x
View Solution -
Draw the graph of y=loge(sinx).
View Solution -
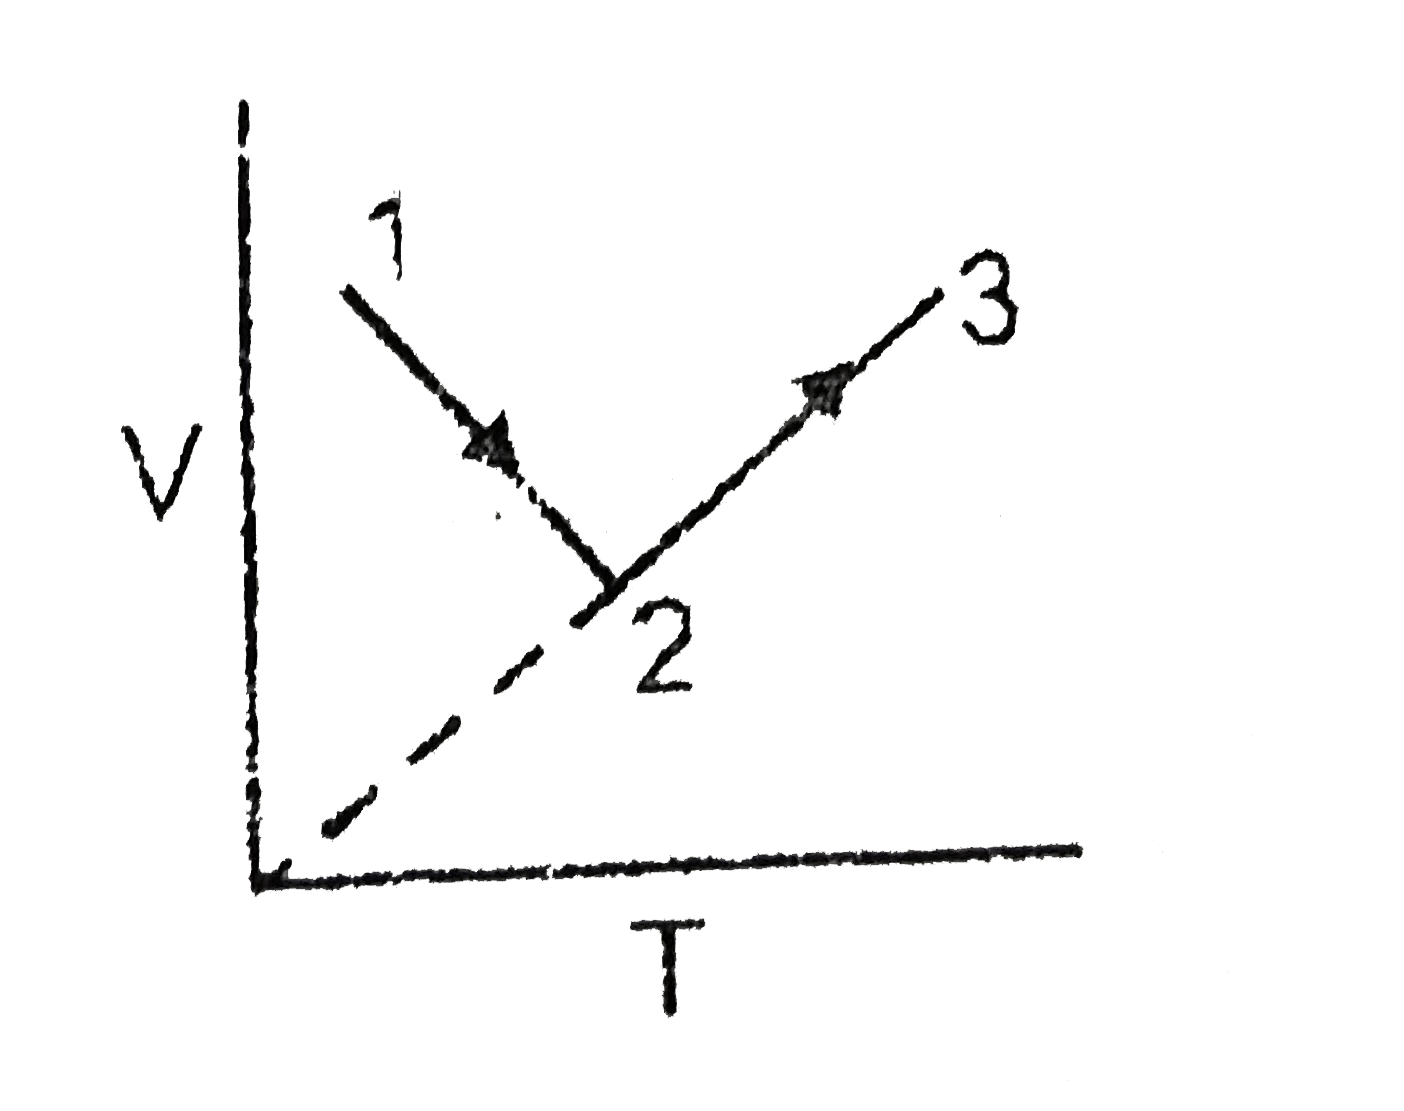
Following graph is constructed for the fixed amount of the gas
 View Solution
 -
Which of the following graphs correctly represents the variation of β=−(dVdP)/V with P for an ideal gas at constant temperature
View Solution