So, you’ve successfully created your first program in Code::Blocks – that is, you have written your source code, made any changes needed, and compiled and built your code. Maybe you got lucky and your program came out just right on the first try. But more likely you’ll need to make edits and debug your code in order to come out with a finished product that works properly.
So let’s learn how to debug in Code::Blocks, which is a popular IDE that many developers use to create code with C/C++ and other languages.

How to debug your program
Debugging your program in Code::Blocks might seem daunting at first, but after we review the process it will become second nature. The process of debugging involves tracing the program operation step by step. You also use the debugging process to place breakpoints where you wish the program to pause. A debugger can pause your program and you can watch the values of the variables that you have defined. This will help you to isolate errors or mistakes in the code. First, let’s talk about using breakpoints.
Using breakpoints
- Set a place in the code to have the program pause. To do this, pull down the Debug and click Run to cursor. The cursor should be over the first line of code where you plan to start the tracing process.

- Move the cursor over the line where you want your program to stop. This is called a breakpoint. Now you can tell the debugger to run the program up to the cursor’s position, or line number. This allows you to see the point where your program malfunctions.
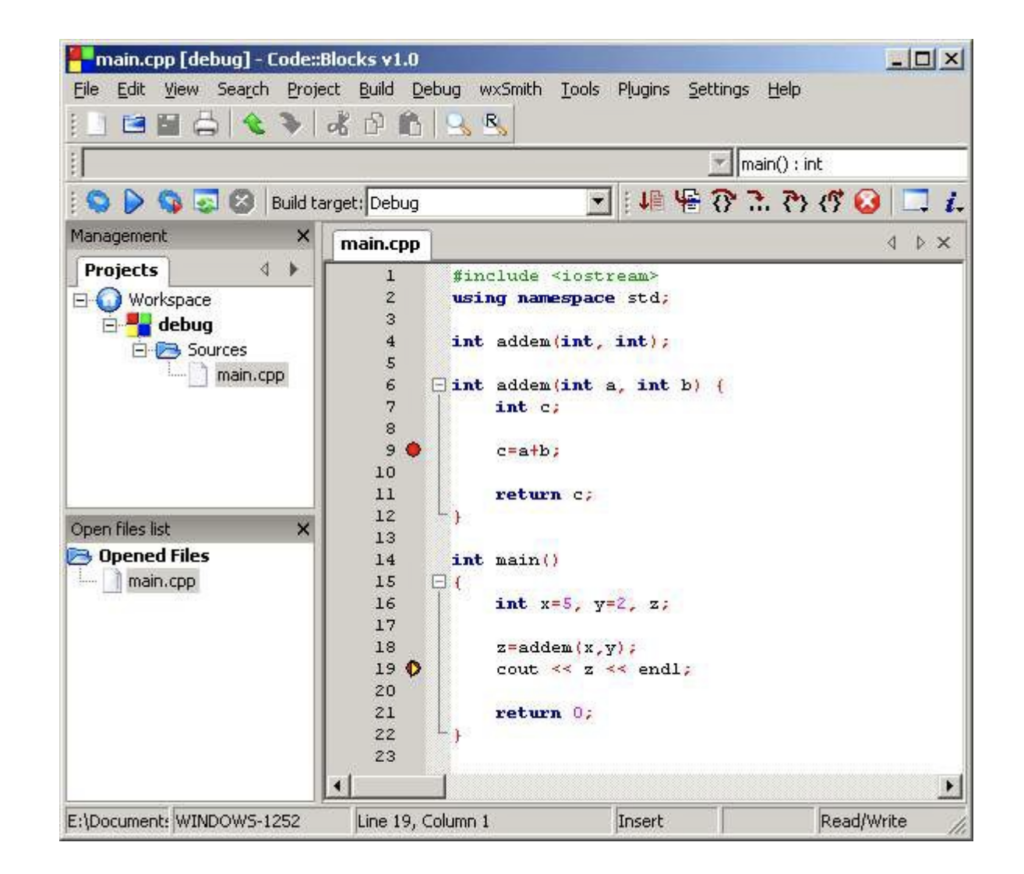
When the debugger detects a breakpoint, the program pauses and the debugger allows you to inspect your code. The breakpoint remains until you remove it. It can be toggled on and off by pressing F5. (Prior to running the program in debug mode, breakpoints will be marked with a red circle. )
Problematic areas of code can now be isolated between breakpoints for easier identification.
Using watches to monitor code variables
To monitor specific variables during the execution of the program, you should open the Watches window. This will highlight the variables in your code.

Do this by going to the Debug pull-down menu. Click Debugging Windows and then Watches. The Watches menu shows a list of the variables in your code. If nothing is next to the listed variable, there is currently nothing assigned to it in the program.
Debug tips
Yellow markers are displayed on the left side of the screen beside the location of breakpoints in the code when the running program has paused. This lets you see the exact location of the breakpoint.

To advance to next line of code, select Next line from the Debug menu. You can also use the F7 key as a keyboard shortcut to accomplish the same task. This allows you to walk through your code line by line in search of errors. This reduces troubleshooting time greatly.
When you are finished debugging, click Continue, and your program will run to the end. If your program is stuck and will not advance, you have the option to choose Stop debugging from the Debug menu.
When you run the debug process, the yellow triangle will show you where the breakpoint has stopped the program from running. The red circle will show the various locations that the breakpoints have been placed throughout the code.
Now that you understand the basics of debugging in Code::Blocks, you are on your way to completion of a successful program. When you have completed the debugging process Code::Blocks will ask you if you want to save your workspace. If so, click yes; it is now safe to exit the program.
Sources:
http://www.codeblocks.org/
http://www.sci.brooklyn.cuny.edu/~goetz/codeblocks/codeblocks-instructions.pdf
https://en.wikipedia.org/wiki/Code::Blocks
Related links:
Download Code::Blocks